Monday’s leadership meeting begins with three versions of revenue. Sales has one figure, finance has another and operations are still working from last Friday’s spreadsheet. Everyone has data, yet nobody is confident enough to make a decision. A well-designed Power BI Dashboard fixes this issue by gathering reliable numbers in one easy to see place so the talk changes from “Which number is right?” to “What do we do now?”
That outcome takes more than connecting a few spreadsheets and adding colorful charts. The dashboard must be built around real business questions, supported by reliable data and designed for the people expected to use it.
What Is a Power BI Dashboard?
A Power BI Dashboard is a single-page canvas in the Power BI service that shows metrics with visual tiles. A Power BI Dashboard gives users an overview of performance and lets them open related reports, for deeper details.
Microsoft distinguishes dashboards from reports for a reason. Dashboards are designed for monitoring. Reports are designed for exploration.
Power BI Dashboard vs. Power BI Report
Imagine a sales executive reviewing the performance. The dashboard can display revenue, pipeline coverage, average deal size and regional variance in one view. If the West region falls short of its target, the sales executive can click the corresponding tile. Open a detailed report.
That report may contain several pages, filters and drill-through options for examining products, accounts and sales representatives. The dashboard reveals where attention is required; the report helps users investigate why.
This distinction keeps executive views concise without taking analytical detail away from the teams that need it.
Begin With the Decision That Needs to Be Made
Dashboard projects often begin with a list of available data sources. That is understandable, but it is rarely the best starting point.
Begin with the decision.
A finance leader may need to identify unexpected cost increases. An operations manager may want to see delayed orders before customers complain. A sales director may need to know whether the current pipeline can support the quarterly forecast.
Once the decision is clear, the right KPIs become easier to define. Every metric should have an agreed calculation, a reliable source, an accountable owner and a clear business response.
For example, displaying customer churn is not enough. Users must understand the period being measured, which customers are included, how churn is calculated and what action should follow when the rate rises.
Without those definitions, a dashboard may look polished while creating more disagreement than clarity.
Build Trust Before Building Visuals
A dashboard cannot repair unreliable data at the presentation layer.
Customer information may come from a CRM revenue may come from a finance platform and fulfillment data may come from an ERP. If the systems use identifiers, use different refresh schedules or use different definitions the dashboard may present conflicting results even when all visuals are technically correct.
Power Query can clean and transform source data. A well-designed semantic model can establish relationships and reusable business definitions. DAX measures can then apply the same calculation logic across reports instead of allowing each department to create its own version.
Naveera’s data engineering services can support source integration, governed pipelines, data quality and reliable inputs for enterprise reporting.
Before publishing, teams should confirm:
- Who owns each source
- How frequently the data is refreshed
- Which system is authoritative
- How duplicates and missing values are handled
- Whether KPI calculations have business approval
- How refresh failures will be detected
A single source of truth does not mean placing every record in one database. It means people use consistent definitions and know where trusted information originates.
Design the Story the User Needs to See
Good power bi data visualization is less about decoration and more about directing attention.
Use KPI cards for essential numbers, line charts for change over time and bar charts for meaningful comparisons. Use tables when exact operational values matter. Avoid selecting a visual simply because it looks impressive.
Layout matters too. The most important information should appear first, followed by the context needed to interpret it. A revenue number becomes more useful when users can compare it with a target, a prior period and its recent direction.
Color should remain consistent. If red signals a problem in one visual, it should not indicate positive performance in another. Too many colors, labels and visual effects compete for attention and make the page harder to scan.
Microsoft suggests using the dashboard as an overview. Try to keep the tiles visible, on one screen whenever you can. Detailed analysis should stay inside the linked reports.
Mobile use needs its attention. A design that works on a screen in the office can be hard to use on a phone. People in positions who look at how things are going while they are on the move need a clear mobile view, not a smaller version of the desktop layout.
Protect Performance, Access and Ownership
A slow dashboard quickly loses credibility. Users may return to spreadsheets if every filter takes several seconds or if scheduled data refreshes fail without explanation.
Performance problems can come from overly complex DAX, inefficient relationships, unnecessary columns, excessive visuals or an unsuitable connection method. Testing should reflect actual usage, including the number of users, expected data volumes and common filtering behavior.
Security cannot be added after deployment. Row-level security can restrict records according to a user’s role—for example, allowing a regional manager to see only the territory they oversee. Microsoft applies these restrictions through roles and row-level filters within the semantic model.
Naveera’s IT infrastructure services can support access controls, cloud operations and monitoring around enterprise analytics environments.
Governance must also answer practical questions: Who can publish? Who approves KPI definitions? Which semantic models are certified? Who investigates failed refreshes? When should an unused dashboard be retired?
Clear ownership prevents the analytics environment from filling with duplicate reports that show slightly different answers.
Measure Whether People Actually Use It
Publishing a Power BI Dashboard is not the finish line. The real test is whether people return to it and use its information.
Track active users, repeat visits, report navigation and usage by department. Then look beyond platform statistics. Has manual reporting time decreased? Are performance exceptions identified earlier? Are meetings spent discussing action instead of reconciling numbers?
Low adoption does not always mean that users need training. Low adoption may also be caused by a dashboard that’s slow hard to read or not linked to the tasks that users do every day. When I talk directly with users I often find problems that the usage numbers do not show.
Treat the dashboard like a business product. Give it an owner, maintain a backlog and update it as business priorities evolve.
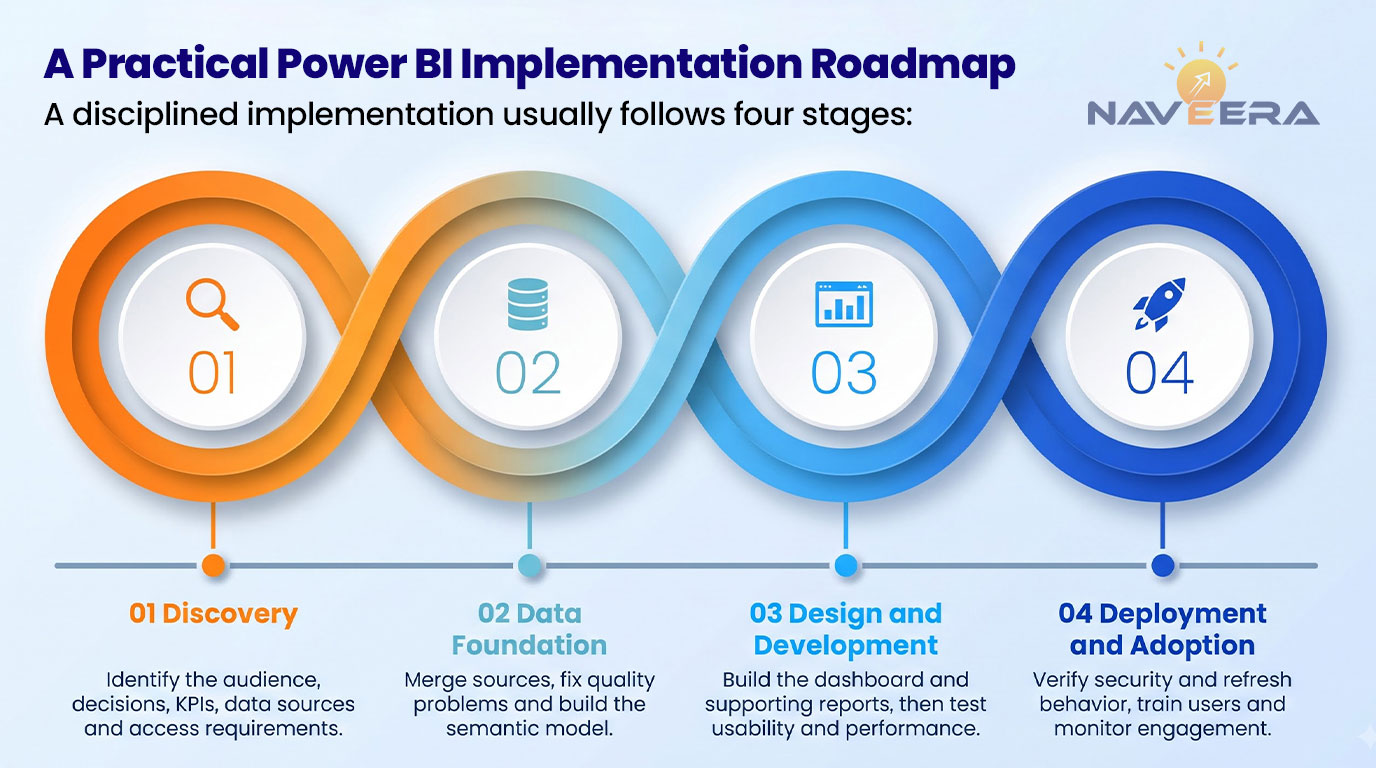
A Practical Power BI Implementation Roadmap
A disciplined implementation usually follows four stages:
- Discovery: Identify the audience the decisions that will be made, the KPIs, the data sources and the access requirements.
- Data foundation: Merge sources together fix any quality problems. Build the semantic model.
- Design and development: Construct the dashboard and the supporting reports then test usability and performance.
- Deployment and adoption: Verify security and the refresh behavior, train users and monitor engagement.
Start with a group instead of launching across the whole enterprise right away. A pilot can reveal definitions missing data and workflow problems while changes remain manageable.
When Are Power BI Consulting Services Useful?
Organizations often think about Power BI consulting services when their own teams struggle with connections, unclear key performance indicators, slow performance, security needs or people not using the tools enough.
The job of the consultant should go beyond making graphs. A good project links the goals of the business with the way data is set up, how data is organized, how it is managed, how people use it and who takes care of it in the future. The company should be able to keep improving the solution once it is done.
How Naveera Technology Supports Power BI Development
Naveera Technology helps organizations move from disconnected reporting to governed business intelligence. Support can include KPI discovery, data integration, semantic modeling, dashboard design, security, deployment and adoption planning.
Naveera’s application development services can also support embedded analytics and custom business applications that use Power BI insights.
The objective is not simply to launch another Power BI Dashboard. It is to give decision-makers a reliable view of performance and a clear route from insight to action.
Talk with Naveera Technology about developing or improving your Power BI environment.
Final Takeaway: Design for the Decision
An effective dashboard does not try to show everything. It shows the right information, to the right person, at the moment a decision must be made.
Start with business questions. Build trusted data beneath them. Keep the experience clear, secure and fast. Then measure whether people use the insight to act.
When those elements work together, Power BI becomes more than a reporting tool. It becomes part of how the organization runs.
FAQ
What is a Power BI Dashboard?
A Power BI Dashboard is a single-page canvas in the Power BI service that presents important metrics through tiles. Users can select those tiles to access the underlying reports and explore additional detail.
What is the difference between a Power BI dashboard and a report?
A dashboard provides a concise monitoring view, while a report supports deeper analysis across multiple pages using filters, slicers and drill-through features.
How do you create an effective Power BI dashboard?
Begin with the decisions users need to make. Define trusted KPIs, build a consistent semantic model and use a clear layout that highlights performance, trends and exceptions.
How does power bi data visualization support business decisions?
A Effective power bi data visualization makes patterns, comparisons and unusual results easier to recognize. Each visual should answer a specific business question and help the user determine what action to take.
How much does Power BI dashboard development cost?
Cost depends on the number and condition of data sources, modeling requirements, security rules, dashboard complexity, refresh needs and number of user groups. An initial assessment is necessary for a dependable estimate.
When should a business use power bi consulting services?
A business should consider power bi consulting services when a business needs power bi consulting services to integrate data to set consistent KPI definitions to strengthen governance to improve performance to secure access or to increase adoption.